

- Zener Diode Definition: A Zener diode is defined as a diode that works in reverse bias for voltage regulation and stabilization.
- Voltage Regulation: Zener diodes keep voltage constant when the reverse bias voltage reaches the Zener breakdown voltage.
- Experiment Steps: To find the Zener breakdown voltage, connect the circuit, increase reverse bias voltage, and record current and voltage readings.
- Breakdown Voltage: The Zener breakdown voltage is the point where the current spikes and the voltage stays constant in reverse bias.
- Different Zener Diodes: Repeat the above experiment with different Zener diodes to find those with the desired breakdown voltage for proper voltage regulation.
The Zener diode mainly operates in reverse biased condition. We use Zener diodes for voltage regulation and voltage stabilisation. They provide a low-cost and no frill method for voltage regulation. The critical parameter of this type of diodes is the Zener breakdown voltage. The Zener breakdown voltage is the minimum reverse biased voltage below which the diode blocks the reverse current through it and above which it causes a significant amount of reverse bias current to flow through it. Once the reverse voltage reaches the Zener breakdown voltage, the voltage across the device remains constant at that level. Hence we can use Zener diode for voltage regulation. The graph of voltage vs current of a diode is called its characteristic. Below you can see the characteristic.
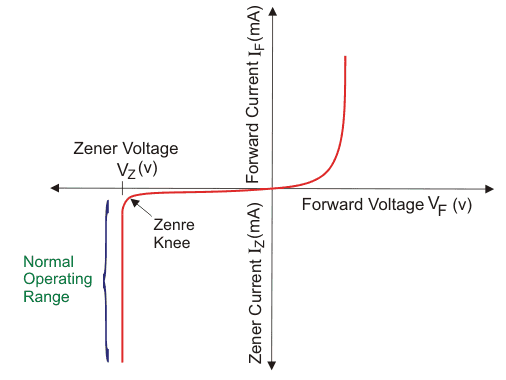
Here Vz is the Zener breakdown voltage. In this experiment, we will find the Zener breakdown voltage and draw the characteristics of Zener diode. This is important because accurate voltage regulation requires knowing the exact voltage across the Zener diode. The Zener breakdown voltage should be close to the desired voltage for proper regulation. We will follow the circuit diagram shown below for this experiment.
We need the following equipment:
- Zener diode
- Milliammeter
- Voltmeter
- Variable DC supply
- Resistors
Connect the circuit as shown in the diagram. The experiment is simple. First, plot the curve in reverse bias mode. Slowly increase the reverse bias voltage in small steps, noting the ammeter and voltmeter readings. There are two ammeters: A1 with the Zener diode and A2 with a resistance 3.3k Ω resistor. When the current in A1 spikes, note the voltmeter reading—this is the Zener breakdown voltage. Continue increasing the reverse bias voltage; the voltage will stay constant, but the current will increase. Record the readings and tabulate the current and voltage values.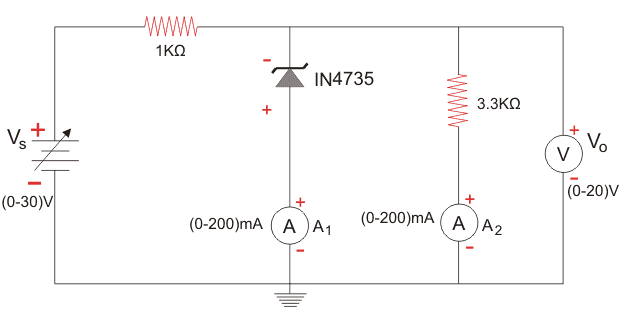
Repeat the experiment by connecting the Zener diode in forward bias. Record the current and voltage readings.
| Voltage | Current |
Your table should look something like the one shown above. Populate the values in the table. Then draw the graph corresponding to these values. You will get the characteristic curve of Zener diode. Note down the value at which the current increases rapidly when in reverse biased mode. The voltage at this value is the Zener breakdown voltage. Note down this voltage separately.
Different Zener diodes have different breakdown voltages. Choose a Zener diode with a breakdown voltage close to the desired voltage. This experiment helps us find the Zener breakdown voltage easily.


")
