

- Digital Data Definition: Digital data in control systems consists of discrete or sampled data that represents continuous signals in a digital format.
- Sampling Process: Sampling is the conversion of analog signals to digital signals using a sampler, which switches ON and OFF.
- Z Transformations: Z transformations in discrete systems are similar to Fourier transforms in continuous systems and include properties like linearity and shifting.
- Hold Circuits: Hold circuits convert discrete data back to continuous form, with types including zero-order and first-order hold circuits.
- Block Diagram of Digital Control System: Represents the components and their interactions within a digital control system.
This article introduces sampled signals and digital data in control systems. A discrete-time signal is defined only at sample instants. Digital data also has quantised amplitude values and an encoded representation. These terms are related but not interchangeable.
Digital control can offer the following implementation benefits, depending on the hardware and design.
- Controller behaviour can be changed in software without rebuilding the signal-processing hardware.
- Algorithms can implement linear or nonlinear logic, although digital data in control system design does not make nonlinear analysis inherently easy.
- One processor can combine feedback, sequencing, diagnostics and communication.
- Stored coefficients and logic are repeatable and are less affected by component drift than an equivalent analogue network.
- Integrated processors can provide compact implementations for complex algorithms.
- Software supports updates, calibration, scheduling and supervisory functions.
- Performance remains limited by sampling, quantisation, delay, numerical precision, sensor noise and actuator hardware.
Sampling converts a continuous-time signal into a sequence of values. An analogue-to-digital converter then quantises and encodes those samples.
Sampling Process
An ideal sampler represents samples with impulses at fixed intervals. A practical converter uses a sample-and-hold stage and finite conversion time. Sampling alone does not quantise amplitude. In discrete-time analysis, the z-transform maps a sequence into a complex-variable representation. It is related to, but distinct from, the Fourier transform.
Define the z-transform as:
where F(k) denotes a sequence,
z is a complex variable,
and F(z) is the z-transform of f(k). Its region of convergence is part of the complete transform description.
Two useful z-transform properties are shown below.
Linearity
For sequences f(k) and g(k), let
where p and q are constants. Taking the z-transform, not the Laplace transform, gives the linearity relation:
Exponential weighting: begin with the z-transform of f(k):
Multiplying the sequence by an exponential changes the z-domain argument as shown: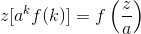
Time-shift property:
The following examples assume the sampling instants t = kT and the transform convention shown above:
For a continuous-time ramp, the transform contains 1/s2 and the sampled sequence is f(k) = kT. Its z-transform is:
For f(t) = t2, the Laplace transformation is 2/s3 and the sampled sequence is f(k) = (kT)². Its z-transform is: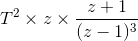

For a sampled exponential, the continuous transform is 1/(s + a) and f(k) = e(-akT). Its z-transform is: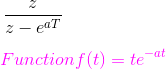
For the related sequence with continuous transform 1/(s + a)2, f(k) = Te-akT. Its z-transform is: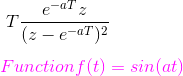
For the sine sequence, the continuous transform is a/(s2 + a2) and f(k) = sin(akT). Its z-transform is: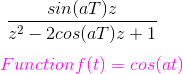
For the cosine sequence, the continuous transform is s/(s2 + a2) and f(k) = cos(akT). Its z-transform is: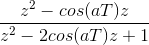
A digital controller’s output sequence must be converted into a continuous-time actuator command. A hold creates that waveform between update instants; it does not recreate the original analogue signal exactly.
Hold Circuits: A hold maps a sequence to a piecewise continuous-time signal between sample instants. Common ideal models include zero-order and first-order holds:
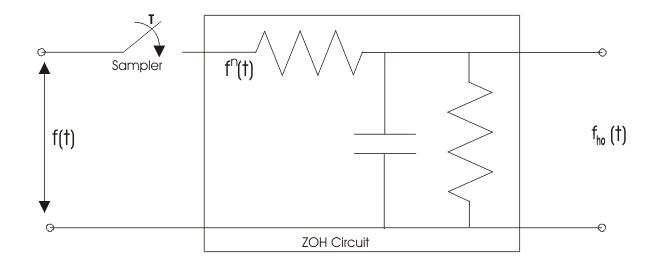
Zero Order Hold Circuit
A zero-order hold keeps each sample value constant for one sampling interval.
The output is a staircase waveform rather than the original continuous input.
The block diagram represents this sample-to-hold process.
For the ideal hold definition used here, write its pulse response as:
Taking the Laplace transform gives: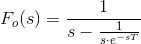
The ideal zero-order-hold transfer function is:
Substituting s = jω gives its frequency response, including sinc-shaped magnitude droop and phase delay. A switch and storage resistor–capacitor circuit can approximate sample-and-hold behaviour, but its non-ideal acquisition, droop and settling must be included in a real design.
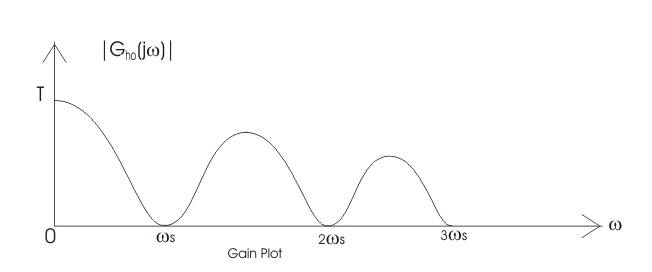 GAIN PLOT – frequency response curve of ZOH
PHASE PLOT – frequency response curve of ZOH
First Order Hold Circuit
The block diagram representation of the first order hold circuit is given below:
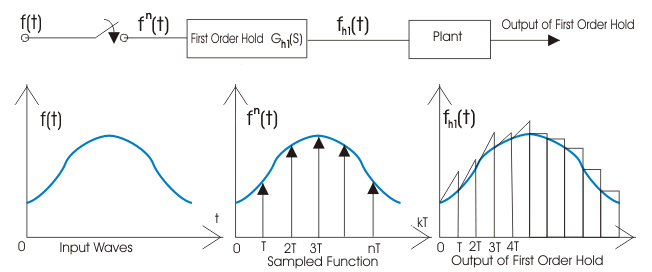
First Order Hold Circuit
A first-order hold forms a linear segment between updates according to its stated causal or delayed convention. It produces a piecewise-linear command, not an exact reconstruction of every input. For the definition used by the displayed derivation, write the output as:
Taking the Laplace transform gives:
The expression (1-e-sT)/s is the zero-order-hold transfer function, so it must not be reused as the first-order-hold result. Substitute s = jω into the correct first-order-hold transfer function for the chosen convention. Normalise the gain consistently before interpreting its magnitude plot; 2π/ωs equals the sampling period rather than a universal starting magnitude.
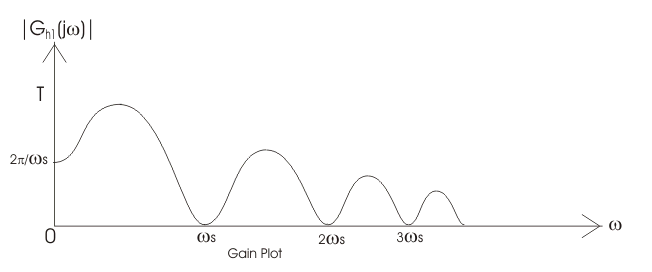
Gain Plot of First Order Hold Circuit


