

- Tristimulus Values Definition: Tristimulus values are the intensities of the primary colors red, green, and blue needed to match a specific color.
- Color Matching Experiment: An experiment to match a test color using adjustable R, G, and B intensities on a screen, helping to determine tristimulus values.
- Spectral Tristimulus Values: These values are derived from matching colors at different wavelengths to achieve the exact color of an object.
- Additive Color Mixing: Colors can be created by combining different amounts of primary colors, and this mixture can be expressed mathematically.
- Chromaticity Coordinates: These coordinates define the color’s hue and saturation, separating them from brightness and are used to describe the color’s chromaticity.
Tristimulus Values
Human photopic colour matching can be described with three independent primary stimuli. In the CIE 1931 RGB experiment, these were red (R), green (G) and blue (B) monochromatic reference lights. Let C denote the test colour stimulus to be matched.
A bipartite field presents the test and matching stimuli side by side. Screen 2 receives test stimulus C, while Screen 1 receives the adjustable combination of the three reference stimuli.
Adjust the R, G and B amounts until the two halves appear identical in colour under the specified viewing conditions. The amounts at this visual match are the RGB tristimulus values for C in that particular primary system.
The match can be written in terms of the three primary amounts:
The experimental arrangement is shown below.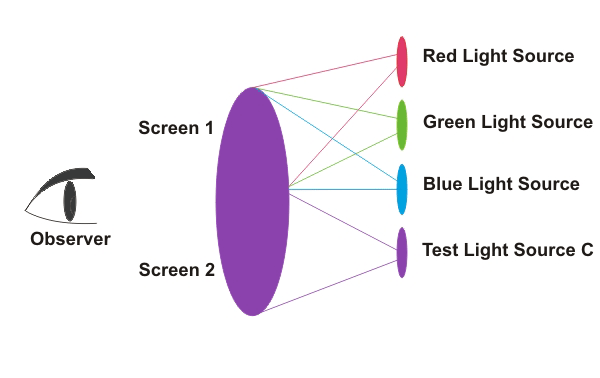
Here r, g and b are signed amounts of the selected primary stimuli.
Repeating the match for monochromatic test lights across wavelength gives the spectral Tristimulus values, also called colour-matching functions.
A trichromator lets the observer adjust and record those three primary amounts. The values depend on the chosen primaries, the standard observer and the viewing conditions, so they must be reported with the colour system.
For an arbitrary test colour C, the match with the selected R, G and B primary stimuli is written as
The symbol ≡ means visually matches under the stated conditions.
Some monochromatic test stimuli cannot be matched by positive amounts of all three real CIE RGB primaries. In those cases, one primary is added to the test side of the bipartite field.
Moving that primary algebraically to the matching side gives it a negative coefficient: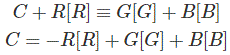
The negative value records which side received the primary; it does not represent negative light.
Colour matching is additive and linear. If one unit of optical power at wavelength λ1, written C(λ1), is matched by R, G and B amounts, then
and if one unit at wavelength λ2, written C(λ2), is matched in the same way, then
the mixture C(λ1) + C(λ2) is matched by adding the corresponding primary amounts:
For a stimulus with spectral power distribution P(λ), the R, G and B tristimulus values are weighted sums of its spectral components: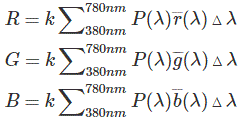
Equivalently, using integrals,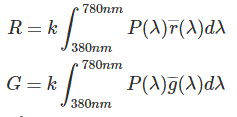
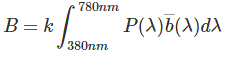
The CIE 1931 RGB colour-matching functions r-bar(λ), g-bar(λ) and b-bar(λ) include negative portions because they use real monochromatic primaries.
Chromaticity Coordinates
It helps to distinguish three ways a colour stimulus can be produced.
- Self-luminous source stimulus
- Illuminated-object stimulus
- Additive mixture of light stimuli
A self-luminous source is described by its emitted spectral distribution. An object’s reflected colour stimulus depends on both the illuminant spectrum and the object’s spectral reflectance; it is not a fixed property of the object alone.
An additive mixture is produced by superimposing light stimuli, so their spectral power distributions and tristimulus values add.
Shining one coloured source on a coloured object is different: the observed spectrum depends on wavelength-by-wavelength multiplication of the illuminant spectrum and the object’s reflectance.
The CIE defined the 1931 XYZ colour-matching functions x-bar(λ), y-bar(λ) and z-bar(λ) through a linear transformation of the original CIE RGB functions. The resulting standard functions have non-negative values over their defined wavelength range.
Let x-bar(λ), y-bar(λ) and z-bar(λ) be the standard functions used to calculate the X, Y and Z Tristimulus values of a colour stimulus with spectral distribution S(λ).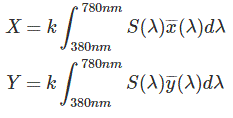
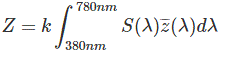
When S(λ) is an absolute radiometric quantity and k = 683 lm/W, Y becomes the corresponding absolute photometric quantity. Other applications use a different normalisation. For an object colour, S(λ) includes the illuminant and the object’s spectral reflectance or transmittance.
These equations connect photometry and radiometry.
In the CIE 1931 XYZ system, Y is proportional to luminance because y-bar(λ) is the photopic luminous-efficiency function. Normalising X, Y and Z by their sum removes overall magnitude and gives chromaticity.
The chromaticity coordinates (x, y, z) are defined as
Because x + y + z = 1, two chromaticity coordinates, usually x and y, determine the third. They describe chromaticity but not luminance. The CIE 1931 x,y diagram is shown below and is not perceptually uniform.
The chromaticity of an additive mixture of two stimuli lies on the straight line segment joining their two chromaticity points. Its location depends on their tristimulus contributions.
The curved boundary is the spectral locus of monochromatic stimuli. Its endpoints are joined by the straight line of purples, which represents non-spectral mixtures of red and violet light. A chosen set of R, G and B display primaries forms a triangle within the diagram; it cannot reproduce every chromaticity inside the full spectral boundary.
Chromaticity of the Additive Mixture of Two Stimuli:
If an aR amount of red is mixed with an aG amount of green, the tristimulus values of the mixture are the sums of the scaled component values: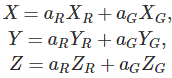
The corresponding chromaticity coordinates are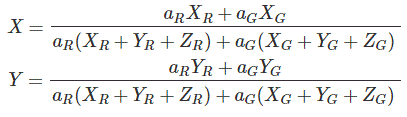
The red contribution to luminance is aRYR, and the green contribution is aGYG.
This weighted interpolation is often called the centre-of-gravity law of additive colour mixture.


