

- Nichols Chart Definition: A Nichols Chart is a graphical representation used to analyze and design feedback control systems by depicting stability and frequency responses.
- Functionality: The chart works by transforming complex frequency responses into a simpler gain phase plane, making it easier to analyze system behavior.
- Applications: Nichols charts are particularly useful in designing compensators for devices like DC motors, emphasizing their role in practical engineering.
- Advantages: One of the major benefits of using a Nichols chart is its ability to graphically determine gain and phase margins, facilitating adjustments to the system’s gain.
- Challenges: Despite its usefulness, the Nichols chart can be less effective for minor gain adjustments due to the deformation of constant magnitude and phase circles.
What is a Nichols Chart?
A Nichols chart plots open-loop gain in decibels against open-loop phase in degrees, with closed-loop magnitude and phase contours on the same axes. It is used in signal processing and control system work to read stability margins and closed-loop frequency response. The chart is named after Nathaniel B. Nichols.
How Does A Nichols Chart Work?
Gain in dB is the vertical axis and phase in degrees is the horizontal axis. Frequency is a parameter along the G(jω) locus. Closed-loop magnitude (M) and closed-loop phase (N) start as circles in the Nyquist plane.
In the G (jω) plane, the constant M and N circles are the loci used to read closed-loop peaking and phase from a polar plot.
Those same M and N loci are redrawn in the gain-phase plane so gain, phase margin and closed-loop peaking can be read without polar construction.
The gain phase plane is the graph having gain in decibels along the ordinate (vertical axis) and phase angle along the abscissa (horizontal axis).
The M and N circles of G (jω) in the gain phase plane are transformed into M and N contours in rectangular coordinates.
A point on a constant-M locus in the G(jω) plane is moved to the gain-phase plane by taking the vector from the origin to that point, then plotting its magnitude in dB and its angle in degrees.
The Nyquist critical point maps to 0 dB and -180 degrees in the gain phase plane. The plot of M and N contours in that plane is the Nichols chart (or Nichols plot).
Lead, lag and lead-lag compensators can be shaped on a Nichols plot by moving the open-loop locus relative to those contours.
The same chart is used on loops that include a DC motor, and on other linear plants whose open-loop G(jω) can be measured or modelled.
The related Nyquist plot in the complex plane is the same G(jω) drawn as a polar curve. At each frequency you can read gain from the radius and phase from the angle.
Phase is the angle from the positive real axis and gain is the distance from the origin. Nichols’ plot uses Cartesian dB and degree axes instead. There are some advantages of Nichols’ plot in control system engineering.
They are:
- Gain margin and phase margin can be read from the locus relative to 0 dB and -180 degrees.
- Closed-loop frequency response follows from where the open-loop locus crosses the M and N contours.
- A change of loop gain is a vertical shift of the locus, which makes gain tuning a translation on the chart.
- Resonant peak, bandwidth and other frequency-domain figures can be taken from those contour crossings.
The M and N contours are warped relative to the original G-plane circles, so a tight interpolation between contours can be harder to judge by eye than a vertical gain shift.
The logarithmic gain transformation deforms those circular G-plane loci into the Nichols grid contours.
A full chart is often drawn for ∠G(jω) from 0 to -360o. Routine stability work uses the strip from about -90o to -270o, around the -180 degree critical phase. The grid repeats after every 360o interval.
If the open loop T.F of unity feedback system G(s) is expressed as
Closed loop T.F is 
Substituting s = jω in the above eq. frequency functions are,
and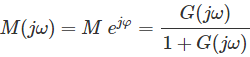
Eliminating G(jω) from the above two eq.
and


